It is usually thought that we can confidently say that if our genotyping results say that we carry a certain genetic variant, that we actually do carry that variant. However, why does this not mean that we can be confident about the prediction about disease risks?
There are many risks and benefits associated with population screening, but it turns out that the results of screening tests, whether they be genetic or otherwise, might not actually provide us with a definitive diagnosis.
Usually, an individual’s test results will categorize them as being either high or low risk for getting a disease. Here, we will explain the ways in which we actually assess the predictive ability of a diagnostic test and why the results that we receive from these tests are simply estimations and not guarantees.
In order to get an idea of the validity of a screening test, it is important to look at the problem from the opposite perspective. Before you look at how probable that it might be for someone to have a particular genotype, you should look at the probability of someone developing it if they have the specific genotype.
If there were a population of 100 people, we know from epidemiological studies that the prevalence of a condition, for this case we will use Madeupitis as an example, in this population is 5%. This means that 5 of the 100 people will develop Maudeupitis, and the remaining 95 people will not.
We can summarise the screening results in the diagram pictured below, and the people colored in blue will develop the disease, and the people colored in green will not develop the disease. The red dot will indicate a positive test result.
Through this test, we can identify that 42 people are likely to develop Madeupitis, and from these people, 4 of them will be true positives, and the rest of the people will be false positives. The positive Prediction value is the number of people with a positive test result that actually go on to develop the condition.
In this case, it is 0.095 of the test population. The test will also categorize 58 people as being unlikely to develop Madeupitis, and one of these will be a false positive. The Negative Prediction value is the number of people with a negative test result that do not develop the condition, which, in this case, is 0.983.
This tells us that the test isn’t accurately identifying cases, and if you are given a positive result, there is no confidence that you will go on to develop it. Essentially, it is not an accurate prediction.
However, if you are given a negative result, you are more than likely not going to develop the condition, and this can be said with confidence. This is problematic for those that are given a positive result, which may, in fact, be false.
This does not mean that a screening test cannot be useful, but it does mean that the accuracy cannot be guaranteed with more complex conditions that have not yet been thoroughly explored. It is highly likely that the predictive accuracy of these tests will continue over time through research and additional testing and screening.
It’s been over eight years since Oxford Nanopore presented the first ever nanopore sequencing data at the AGBT conference in February 2012, where they provided an overview of the hardware and software behind the GridION and MinION systems.
Even today Oxford Nanopore could be seen as a dark horse. Their GridION platform is used to run all their nanopore technology, including DNA sequencing and protein analysis. This machine, though seemingly small, is extremely powerful when used in combination with other Nanopore machines.
Today we’re revisiting these machines to look at what it is that makes them so efficient, and effective, for cluster sequencing.
At first glance, these machines are small and low-cost. Like the Ion Torrent, MiSeq and GS Junior, the Nanopore machines are suitable to sit on the bench of a small lab, and are ideal for running small projects that have tight budgets and limited floorspace.
While they look slightly dated, these machines are actually designed to fit together in standard computing cluster racks, and Oxford Nanopore refer to each of the individual machines as “nodes”.
The nodes connect together via a standard network, and can talk to each other, as well as report data in real time through their network to other computers.
When joined together like this, one machine can be designated as the control node, and during sequencing many nodes can be assigned to sequence the same sample, which maximizes efficiency.
Another strength highlighted by Nanopore is the ability of the machines to react in real time, changing aspects of their behaviour depending on the orders given during sequencing.
Some of these adaptations will be automatic quality-control changes, for example, the salt concentration and the temperature can change to optimize efficiency and quality.
The machines can also be given basic preset targets which means that you can run the machine until you have what you want, rather than running it for a set period of time.
These machines can handle up to 96 different samples simultaneously, so you can decide to sequence one sample until you have enough DNA from it, then move onto another one, and so on.
The machines can communicate with each other, so four machines could sequence the same sample, and stop once they had produced enough sequence between them.
It goes without saying that the cost and accuracy will play a significant role in assessing how strong a prospective machine would be.
However, providing the throughput is high enough, the fact that the technology is single molecule should keep the enzyme cost down.
Ultimately, these machines continue to lead the way in cluster sequencing, providing maximum efficiency.
For more information on the system, see the website. They have also produced a helpful video that explains the system:
I agreed to make my 23andMe genotyping results available publicly as part of GNZ because I knew that the results were slightly dull, and I’m not majorly at high or low risk for any diseases.
I was also very unsurprised to find out that I have blue eyes and that I was identified to be most likely descended from Northern European Ancestry.
A few hours after releasing the data, I was directed to Dienekes Pontikos’ post, where they wrote about the results of running all our data through his ancestry prediction program.
Most people were predicted to be of Northwestern European descent, and I was given an estimate of 20% Ashkenazi Jewish ancestry. When asked about this, I had no answers to give and instead decided to do my own research.
This program is based on a paper that explores the differences in allele frequencies in European Americans.
In the study, the authors identified two main components of variation in ancestry that corresponded to three groups: Mostly northwest European descent, southeast European descent, and Ashkenazi Jewish descent.
They created a list of 300 genetic markers that gave information about the ancestry in the sample, which was made publicly available.
The program uses those allele frequencies at the level of markers in the 23andMe platform to infer the proportional membership of an individual from each group.
If someone has the genotype CC at an SNP, and the C allele has 20% frequency in northwestern Europe and 60% frequency in Ashkenazi, the person is more likely to be Ashkenazi. This method put me at 20% Ashkenazi ancestry, but with not enough data to make this a confident statement.
The question left to be answered is ‘what does this mean?’ It doesn’t mean that I have 20% Ashkenazi ancestry; it means that I carry the alleles that are rare in Europe and more common in the Ashkenazi Jewish population.
However, this is based on the assumption that my ancestry only goes back to these three locations.
Knowing that I had a grandparent of Italian descent, I tested for southern European ancestry. It is also commonly known that southern European populations are similar to the Ashkenazi populations in relation to genetics.
In order to explore how the GNZ participants relate to European populations, I was able to combine multiple data sources. These were from the Human Genome Diversity Panel, the 12 GNZ individuals, and a set of Ashkenazi Jewish individuals.
They were all genotyped on Illumina arrays. To begin to look at the relationships between these individuals, I used the smartpca program to look at the average genetic relationships between the populations.
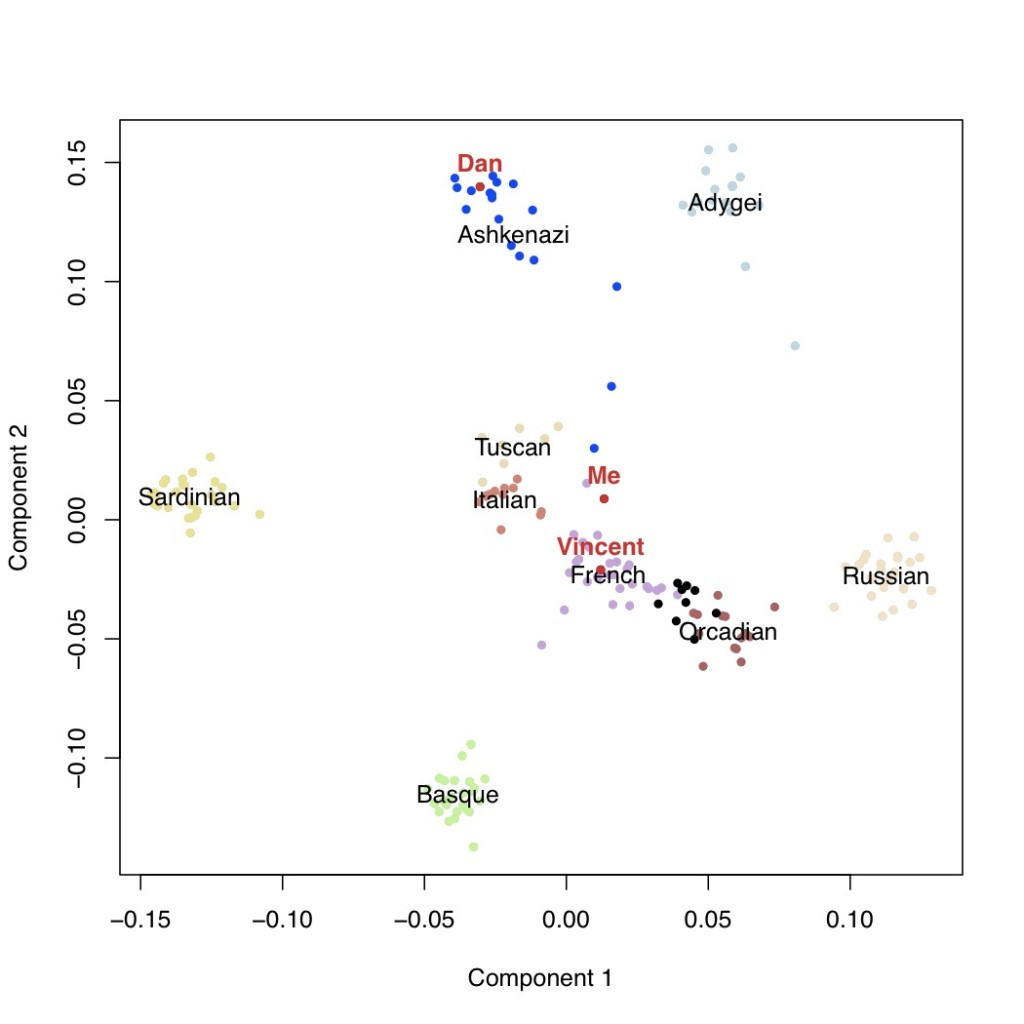
In the below plot, each point is an individual on the most important axis of genetic variation in this sample. The Ashkenazi population is blue, and the GNZ individuals are black.
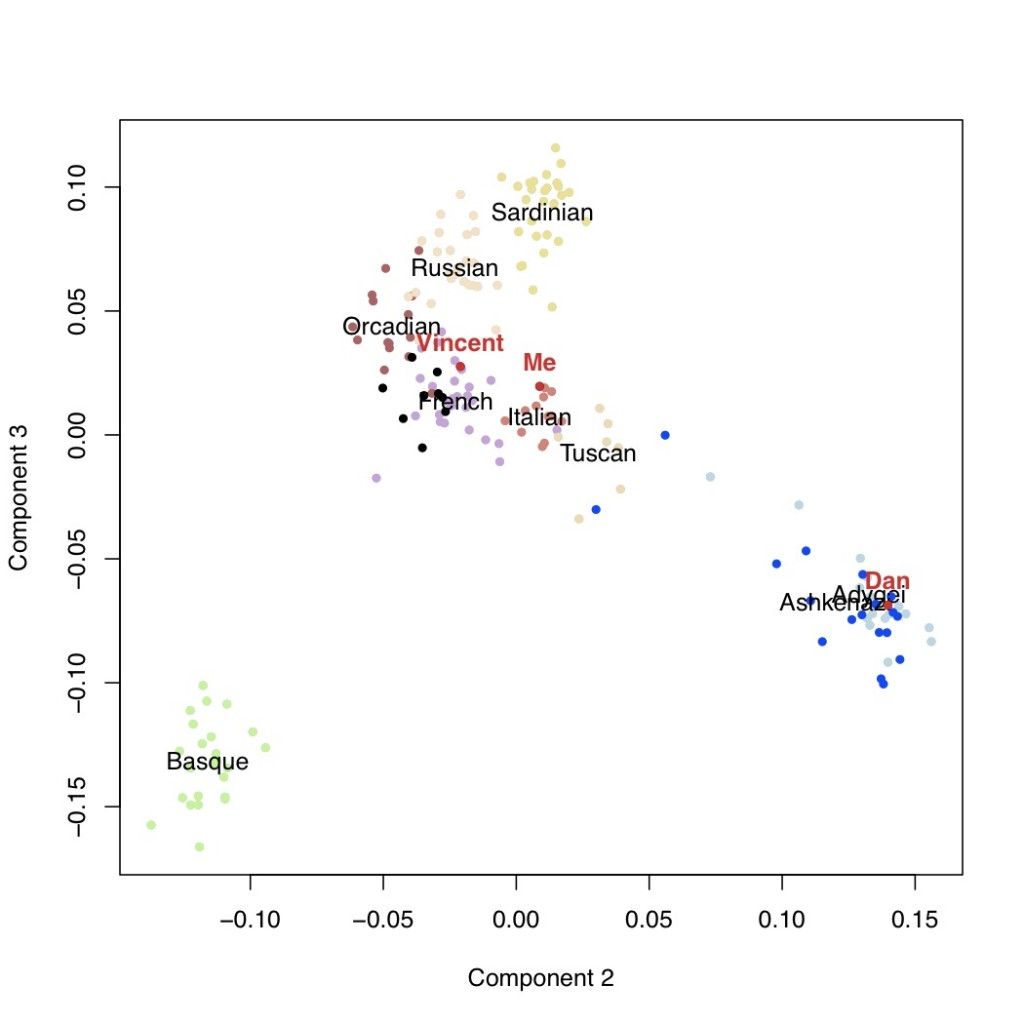
Dan is with the Ashkenazi population, Vincent with the French, and me with the French on component 1 and the Italians on component 2.
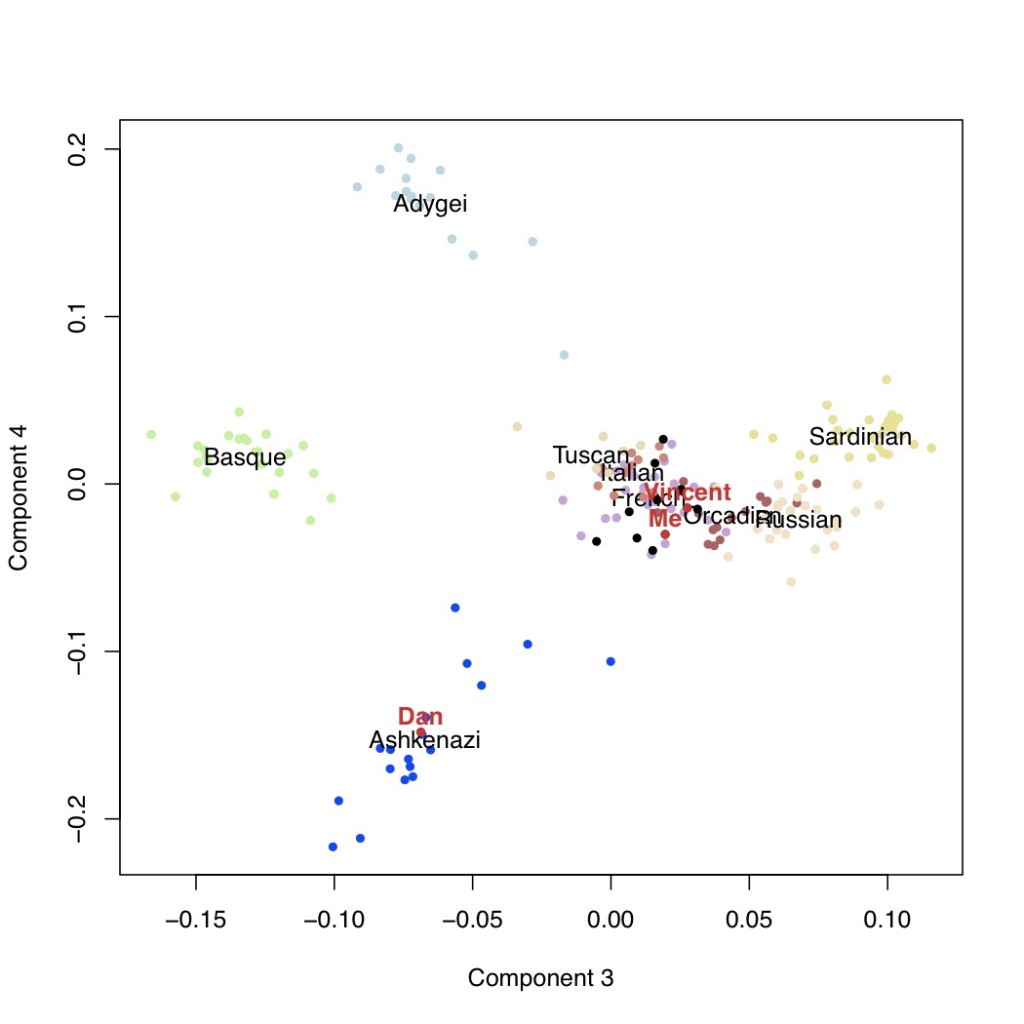
Next are the additional components of variation with the second versus third components, followed by the third versus the fourth.
The fourth axis of variation separates the Ashkenazi population from the rest of Europe.
The analysis suggests that I do not have any Ashkenazi Jewish ancestry, and the results were actually hidden south European ancestry.
I have satisfied my curiosity surrounding my knowledge of family history, and it seems I have a small amount of south European ancestry mixed with a large amount of northwest European ancestry.
At the annual Advances in Genome Biology and Technology (AGBT) conference held in Florida during 2012, there were many exciting announcements and developments in the world of DNA sequencing technology.
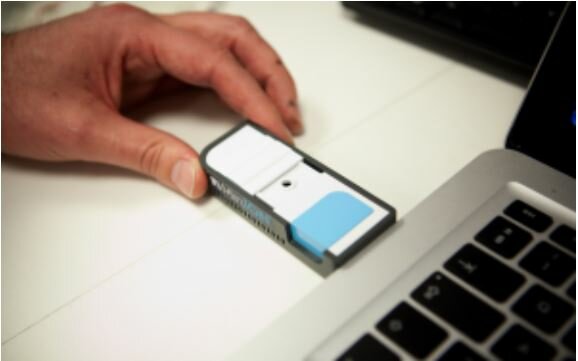
An especially cool piece of news came from the team at Oxford Nanopore, the stars of our piece on cluster sequencing, about their (then) brand new sequencing machine.Much of the hype surrounded the focal point of the above image, a MinION. No, we don’t mean those banana loving yellow fools, but in fact a minuscule, disposable USB-key sequencer, capable of sequencing a whopping one billion base pairs of DNA from the comfort of your own lap.
Though it was initially a pricey purchase at between $500 and $900, its applications were seemingly endless. Being able to take some biological matter, combine it with a couple of chemicals, and then read its DNA was considered revolutionary. By no means affordable, it was the first tentative step into DNA experimentation at home.
A second, slightly less exciting but equally as intriguing announcement, was that of the GridION sequencing machine.
Built to read a great deal of DNA to scale up at humongous sequencing centers, it was able to read long strings of data that had previously been unthinkable (at least in a way as reliable as the human brain!)
What implications did these products have on those with a personal interest in genomics?
According to their estimations, one GridION machine, also referred to as a node, could read sequence as fast as 600 million base pairs an hour, the equivalent of 14GPB per day, and read high coverage (30x) human genome in less than six days.
Stacking up four nodes, you could therefore produce sequences working at a similar rate to Illumina’s high-end HiSeq 2500 machine.
At around $2200-$3600 for each genome, the machine was considered a new competitor in terms of throughput, data quality, and expenses, which at the time was a pretty sizeable achievement in comparison to the major sequencing companies from a smaller producer.
What was particularly clever about Oxford Nanopore’s inventions was that they avoided some of the difficulties traditionally found in DNA sequencing; each sequencer was tiny and stacked efficiently, with 20 units equating to the size of a traditional HiSeq at only a fifth of the footprint per genome.
Power consumption was also considerably reduced, and preparing DNA for sequencing takes moments as opposed to days of processing and much more expensive equipment. When people examine this company retrospectively, they will be able to clearly recognize their contribution to the simplification of genome sequencing.
This wasn’t just about reducing the cost - though they did, by a staggering 20% - but making at-home, outside the lab sequencing a possibility altogether. Nobody thinks about the price decrease in recent years, but everyone certainly remembers when Oxford Nanopore used a laptop computer to sequence rabbit DNA.
Alzheimer’s disease is a form of dementia that impacts the brain and results in memory loss. In recent years we have been able to study it and its risk factors to calculate the chances of you being affected by the disease. Today we are going to look at how that risk is calculated.
Most people who develop Alzheimer’s are elderly and near the end of their lives. However, this is not always the case. Looking into calculating your risk can be interesting and done using APOE environmental factors and other risks.
It is important to remember that this number is not absolute and can be subject to change. If you are concerned, make sure to consult your doctor.
The Apolipoprotein E (APOE) gene works to protect against Alzheimer’s. The gene has different alleles, some work to protect you from Alzheimer’s, whereas others increase your risk. We all have two copies of this allele, and it's this combination that can determine your risk.
You can find this information out by having genome testing done or speaking to a healthcare professional. If there is a history of Alzheimer’s in your family, it may be offered to you.
Even without genotyping, you can work this out yourself by using genetic programs such as Beagle, which can help give you an odds ratio of developing Alzheimer’s at some point in your life.
APOE is a significant genetic risk factor for Alzheimer’s, but it is not alone. The below table shows five other variants.
Gene | Variant | Risk Allele | 0 | 1 | 2 |
CR1 | rs3818361 | A | 0.89 | 1.10 | 1.35 |
CLU | rs11136000 | C | 0.83 | 0.97 | 1.12 |
PICALM | rs541458 | T | 0.75 | 0.92 | 1.13 |
ACE | rs1800764 | T | 0.83 | 0.98 | 1.16 |
CST3 | rs1064039 | C | 0.75 | 0.90 | 1.08 |
The odds are calculated by counting the risk alleles for each variant and times them for all variants.
You can combine this with APOE odds ratios, which will provide a more accurate odds ratio of developing Alzheimer’s.
Environmental factors won’t influence Alzehimer’s as strongly as APOE, but they are still factors to be aware of.
Most of these risks apply to older people and include vascular disease and head trauma, for example.
Other risk factors apply more widely, such as physical activity, education, and alcohol consumption. The below table looks at these risks.
Risk Factor | Class | OR |
Education | 0-8yrs | 1.36 |
9-12ys | 0.98 | |
>12yrs | 0.72 | |
Regular Exercise | Yes | 0.89 |
No | 1.28 | |
Alcohol consumption | Yes | 0.73 |
No | 1.27 |
Some research into genetics and the environment has been done, but not enough to present to you today.
We can consider genetics and the environment separately to multiply ratio odds to get an overall odd ratio.
Using 23andMe’s v2 chip, we can assess the APOE risk through genotype imputation. From this, we can infer a predictive medical factor by using ‘non-medical’ variants. There is the issue of privacy with this and any attempt to separate the medical and non-medical information.
So what do we do with the information? While there is no concrete preventative measures and limited treatment options, it’s down to lifestyle.
Regular exercise and eating less fat and red meat can work to help reduce your risk. As everyone’s risks are different, it’s not necessarily the holy-grail answer for everyone.
It is worth checking with a healthcare professional if you are unsure of what you can do.
A little while back, Razib Khan used data from 23andMe to explore his family’s genetic history. He previously published his findings and summarized them. Today, I’m going to fill you in on what he had to say!
Khan was interested in genetics, anthropology, and history, mainly how we have changed the way lineages are marked thanks to the increase of technology. This developed a curiosity for Khan to learn more about his genome.
Khan’s family are from the Comilla district in Bengal; all four of his grandparents were ethnic Bengali’s, and appearance-wise, he looks typically South Asian. He had some skepticism about the test and his genome.
Khan comes from a large family, where both his parents have many siblings. The large family has allowed Khan to have already a sense of his risks for certain diseases, along with the knowledge of his family’s medical history.
Skeptical but curious, Khan tried out 23andMe during a sale offer. Expecting a generic result, Khan was surprised by the results. 23andMe’s ancestry painting algorithm.
This calculated Khan as 57% European, 43% Asain, and less than 1% African. Initially, Khan thought the Asian percentage was a little high, so he asked to see whether other South Asians had received such a high value. The answer was none had.
From his ‘gene sharing,’ he found that generally, the Asian range from 23andMe’s algorithm was 10-35%. The lower portion of this percentage was from people in the northwest of the Indian subcontinent.
Those higher values were coming from the east and south. Intrigued by this, Khan consulted the paper Reconstructing Indian History, which explained this wide percentage range.
The paper explained that South Asians are a combination of the European-like population and a marginally Asian-like population, made up of Ancestral Northern Indians (ANI) and Ancestral South Indians (ASI).
The former’s mixture went from 75% in the northwest to 45% in the far south. The paper cites the class system as a contributing factor to this. Khan assumed that his high Asian percentage was due to having more ASI than the norm.
There was skepticism towards this due to the Comilla district borders, which would indicate that he has Tibeto-Burman ancestry that he may not have been aware of.
Neither of his parents was aware of a potential link, and 23andMe does not offer a more detailed response, leaving Khan with some uncertainty.
Khan decided to use 23andMe to genotype his parents and gain more insight into his family's heritage. During the waiting time, he spoke on his blog about his predicted outcomes of these tests.
Khan initially thought that his father’s heritage might have been different from what they believed and wrote some extensive blog posts on this issue. The results from 23andMe stated that his father was less Asian than his mother.
Khan ran their date through ADMIXTURE and EIGENSOFT using various parameters, and overwhelmingly the results said that his mother was more Asian than his father, leaving him with conflicting advice.
Khan returned to the drawing board, looking at oral histories from both sides of the family, consulting origins of Tibeto-Burman ancestry and the possibility of eastern Bengali Muslims being in his lineage.
From his research, he concluded that he had no real change in terms of his self-conception, but rather Khan was now intrigued by historical population genetics instead of scientific genealogy.
Khan concluded that although not much was revealed to him about his family, it is a hobby he has decided to keep hoping that more knowledge will become available in the future.
In May 2019, it was reported in an article that over ten thousand sequence mismatches were observed between messenger RNA and DNA from the same individuals.
More recently, three technical comments were published by Science surrounding this article. It was concluded that at least 90% of the Li et al. RDD sites are technical artifacts. Here, we are going to explain how this conclusion was drawn.
For each RDD site that had at least five reads mismatching the genome, it was calculated that the fraction of reads with the mismatch, or the match, at each position in the alignment of the RNA-seq read to the genome on the + DNA strand.
Over 10,000 exonic RDD sites were found, which included thousands of RDD sites that were predicted to change protein sequence. These results actually implied the existence of a minimum of one, if not more, novel mechanisms of gene regulation.
This questioned some of the basic assumptions that are used daily in genetics.
It turns out that it is not the existence of RDD sites that was so surprising; it was the significant biological impact of the sites and the subsequent implication that there are new regulatory pathways that were not previously known to us.
The reason that some think that all of the RDD sites in Li et al. are false positives is that two groups have raised issues regarding the reported RDD sites. Both of these sources claimed that the majority of the sites presented in the findings were false positives.
Actually, mismatches to the genome at RDD sites are almost always occurring at the ends of sequencing reads. All three of the technical comments that were made after the paper was published had included this observation.
In response to the comments being made, a plausible explanation was proposed for the observations. To generate the cDNA, they added random short DNA sequences to each sample that acted as a primer for a DNA synthesis reaction.
At some sites, the random primers were not perfect matches to the mRNA, but they were still able to bind. During synthesis, the mismatches from the primers were incorporated into the cDNA, and this, in turn, led to a false signal of RNA editing. This explains the previous results.
Another exercise that aimed to validate the finding had involved identifying peptide sequences that correspond to ‘edited’ RDD sites. It was pointed out that many of these sequences are actually good matches to multiple genes.
It was concluded that these RDD sites are false positives due to mismatched reads from paralogous genes.
In conclusion, when looking for regions of the genome that look strange during an analysis, an individual will find strange and unexpected results. This applies even when a systematic error only affects 0.001% of the bases in the genome.
It turns out that the most interesting findings are actually less likely to be real. This was discovered through the process of finding false positives and mismatched results.
However, it does remain a possibility that forms of RNA editing that have not always been known are active in humans, and RNA sequencing technology can be helpful in finding out if new forms do exist.
The common notion running through molecular biology is that the information present in DNA is transferred to RNA and then to protein.
Back in 2010, researchers made a potentially ground-breaking observation.
They found that within any given individual, there are tens of thousands of places where transcribed RNA does not match the template DNA from which it is derived.
In humans, it is generally thought to be limited to conversions of the base adenosine to the base inosine (which is read as guanine by DNA sequencers), and occasionally from cytosine to uracil.
However, these authors reported something new. They found that any type of base can be converted to any other type of base. If their observations are correct, these findings represent a fundamental change in how we view the process of gene regulation.
The authors of this study sequenced the mRNA expressed by an individual (or rather, cDNA from a cell line derived from the individual). They then obtained DNA sequences from the same individual and compared the two.
Any difference between the RNA and DNA was taken as an indication of RNA editing. However, because it is impossible to sequence an entire mRNA or genome in a single pass, the researchers used short reads (of 50 bases) from the mRNA of the individual and reads of various lengths from the DNA of the individual.
They then matched these sequencing reads to the genome (or transcriptome) to see where they came from.
However, there are several complications with this method: choosing the best spot to take reads from involves several assumptions, including how you weight insertions and deletions and possible sequencing errors.
These sorts of mapping issues are well understood and have been widely discussed in the literature on SNP calling from sequencing data, which is another situation where the researcher is looking for a difference between a sequencing read and the genome.
A naïve SNP caller that just looks for differences between aligned reads and a genome will output tens (or probably hundreds) of thousands of false-positive SNPs which must be filtered out by various criteria.
Therefore, mismapping of reads in paralogous regions can lead to false signals of RNA editing, and these false signals can even be replicated in follow-up experiments like those done by Li et al. (2011).
This is because the two forms of RNA and protein are indeed present in the cell, giving the illusion of RNA editing.
However, the two forms of RNA and protein do not come from the same DNA sequence, and thus are not evidence of RNA editing.
Besides, mapping biases around splice sites (and other sorts of insertions/deletions in the genome) will cause mismapping and false inference of RNA editing.
So in conclusion, while RNA editing is a potentially important phenomenon in humans, there is significant scope for further research, and skepticism of studies carried out so far certainly seems warranted.
This was once a guest post by Karol Estrada, who was a postdoctoral research fellow in the Analytic and Translational Research Unit at Massachusetts General Hospital and the Broad Institute of MIT and Harvard.
It was written in memory of Laura Riba. We have briefly summarised her thoughts and findings from that post below.
Karol discusses her new paper, which was published in the Journal of the American Medical Association. It discusses the low-frequency missense variant in the gene HNF1A that increases the risk of type 2 diabetes by five times and was only seen in Latinos.
It was the largest study to date, with a sample of nearly 4,000 people. They undertook whole-exome sequencing of 1,794 type 2 diabetes cases and 1,962 healthy controls from four studies of Mexicans and also Latinos.
A paper from 2013 called Nature found that a set of four variants in the SLC16A11 gene increases the risk of type 2 diabetes. The variants are from the same haplotype which is common in people from Latin America but rare in people of European ancestry.
In accordance with the Nature paper, their JAMA study reinforces the importance of studying populations that have not yet participated in genomic research. They found the low-frequency variant HNF1A in 2% of type 2 diabetes cases and 0.4% of healthy controls.
This is the largest ever effect seen of a type 2 diabetes variant that’s found in more than 0.1% of the population. The variant was only identifiable in Latio people as well and could not be found in public genetic databases.
Their study did not find any other low-frequency or rare variants associated with type 2 diabetes above genome-wide statistical significance, the HNF1A was the only one.
However, they did note that to identify rare causal variants will require a higher sample of cases and controls, often in the tens of thousands.
The variant HNF1A that they discovered has indications beyond its design insinuating that a case study into how perceptions of the disease are not subtle enough to match reality.
HNF1A is one of the 13 known MODY (maturity-onset diabetes of the young) genes, however, the people who carried the HNF1A gene in their study don’t have the typical recognizable attributes of MODY.
These people look more than like regular type 2 diabetes patients who are either overweight to obese and who developed diabetes later on in life, additionally not everyone who carried the HNF1A variant had diabetes, they found 12 carriers who were completely healthy.
They soon discovered that MODY and other rare diseases are a lot more complicated than they initially thought, this was backed up by a previous study at the Framingham Heart Study that showed that 1.5% of the randomly selected participants carried the MODY mutation but had completely normal glucose levels.
This reinforces that mutations of rare diseases can also be identified in healthy people, but because studies have only been done on the mutations in people who have diseases, it’s hard to clarify.
The article concludes with them stating how much work remains to still be done in this area but also puts forth the idea that genotyping a single low-frequency variant could help hundreds of thousands of people suffering from not just diabetes, but other deadly diseases whilst also contributing to the reduction of the cost of healthcare.
Tensions were high today at the US Congress Committee on Energy and Commerce hearing into direct-to-consumer (DTC) genetic testing.
Three spokespersons from the 3 major DTC testing companies (Navigenics, 23AndMe and Pathways Genomics) were made to defend their companies and the DTC industry whilst some of the committee members found it difficult to pick out the genuine companies from the scammers.
However, it doesn’t stop there. A new report of an undercover mission by the US Government Accountability Office (GAO) which covers the results of anonymous purchases of DTC kits from four companies and also an assessment of the deceptive marketing of 11 other companies.
The scepticism from GAO was based on the reporting, marketing and the scientific foundation in which the companies operate which added to the already climbing apprehension triggered by FDA meetings on lab-developed tests and also the recent warning letters received by another 14 genetic testing providers.
But that’s not even everything, there was also secretly taped recording included in the report covering conversations between GAO and some DTC companies.
In the tapes, the company Navigenics can be heard giving breast cancer advice whilst Pathway Genomics can be heard advocating the use of non-consensual DNA testing.
The other companies on the tape are presumed to be of the other anonymous companies and not part of the four creditable companies.
The tape really does not shed DTC in a good light, as badly-trained call operators from genuine companies can be heard unknowingly throwing the entire DTC industry under the bus.
Other clips in the tape cover a scam operation, which are not the products offered by the likes of 23AndMe and deCODEme.
The report reveals that individuals and consumers of DTC from certain companies were given advice information based on probability and not scientific diagnosis.
There was also a clear problem in consistency, where the same individual was given completely different risk predictions from various companies, which has been a common cynicism raised since the industry began, which now calls for an improvement on inclusion and background risk figures for the entire industry.
The report also declares that the ‘fake customers’ of GAO who were of non-European ancestry were not informed prior to purchasing that their risk predictions would be unreliable due to the lack of current genetic research outside of US and European populations.
The report appears to be unfairly one-sided, comparing the hard work of reliable companies who offer valid products with scammers trying to be a quick buck.
It tarnishes the entire industry with the same untrustworthy brush and overlooks technical accuracy of the companies products and service and doesn’t take into account the high number of more than satisfied customers.
We feel strongly that these reports are exaggerated on to lower public confidence in the industry and have scepticism published in news agencies across the globe.
The impact of this report is already apparent and visible in the industry, with several DTC companies leaving the market and only having their products available for private programs and some companies getting rid of some of their services such as disease risk predictions.
There seems to be general support of increased regulation today (especially by the committee) which after the reporting of findings today, will leave no room mistakes for the industry and clamp down on innovation.
I feel like this is a power-grab by the FDA, who will override small labs and startups who are seeking and researching new technologies for genetic testing.
Those in genomic medicine will simply pack up and move somewhere else in order to keep the industry alive if it becomes too difficult under new regulations in the US.