Archive for the 'Analysis' Category

Eight types of schizophrenia? Not so fast…

Editor’s note: this guest post was contributed by ten leading psychiatric geneticists (see author list at the end of the post) in response to the headline-grabbing claims of a recent paper claiming to have identified eight genetic sub-types of schizophrenia. Similar text has also been posted on PubMed Commons and elsewhere. [DM]

In a study published on September 15, Arnedo et al. asserted that schizophrenia is a heterogeneous group of disorders underpinned by different genetic networks mapping to differing sets of clinical symptoms. As a result of their analyses, Arnedo et al. have made remarkable and perhaps unprecedented claims regarding their capacity to subtype schizophrenia. This paper has received considerable media attention. One claim features in many media reports, that schizophrenia can be delineated into “8 types”. If these claims are replicable and consistent, then the work reported in this paper would constitute an important advance into our knowledge of the etiology of schizophrenia.

Unfortunately, these extraordinary claims are not justified by the data and analyses presented. Their claims are based upon complex (and we believe flawed) analyses that are said to reveal links between clusters of clinical data points and patterns of data generated by looking at millions of genetic data points. Instead of the complexities favored by Arnedo et al., there are far simpler alternative explanations for the patterns they observed. We believe that the authors have not excluded important alternative explanations – if we are correct, then the major conclusions of this paper are invalidated.
Continue reading ‘Eight types of schizophrenia? Not so fast…’
Pertinent and Non-pertinent Genomic Findings

About Guest Co-Author: Dr Ewan Birney is Associate Director of the EMBL European Bioinformatics Institute and a fellow blogger.

The ACMG recommendations on clinical genomic screening released earlier this year generated quite a storm. Criticisms broadly related to:

  • the principle of whether we are ready and able to offer genomic screening to people undergoing exome/genome sequencing (the topic of this post!);
  • to whom the recommendations should apply
  • whether individuals have a right to refuse genomic screening results; and
  • the exact content of the list of genes/variants to be screened.

In the UK, this debate has come into sharp focus following the launch of the NHS 100,000 genome project, where details of data interpretation and data sharing are still rather hazy. The central policy question is clear: in the context of clinical practice, how should we be using genomic data, and with whom, in order to maximise its benefits for patients? (In the context of research, as broad as possible sharing consistent with patient consent is most desirable.) Last month, we published a paper in the BMJ – along with a number of genetic scientists, clinical geneticists and other health specialists – advocating an evidence-based approach that places the emphasis on targeted diagnosis in the short term, and gathering evidence for possible broader uses in future.

Continue reading ‘Pertinent and Non-pertinent Genomic Findings’

Henrietta Lacks’s genome sequence has been publicly available for years

Last week, scientists at the European Molecular Biology Laboratory reported that they had sequenced the genome of the Henrietta Lacks, or “HeLa”, cell line. This report was met with considerable consternation by those who (justifiably, in my opinion) wondered why scientists are still experimenting on a cell line obtained without consent in the 1950s [1]. In response to a bit of a backlash, the researchers removed the HeLa sequence from the public internet, and even the paper itself might disappear from the formal scientific literature.

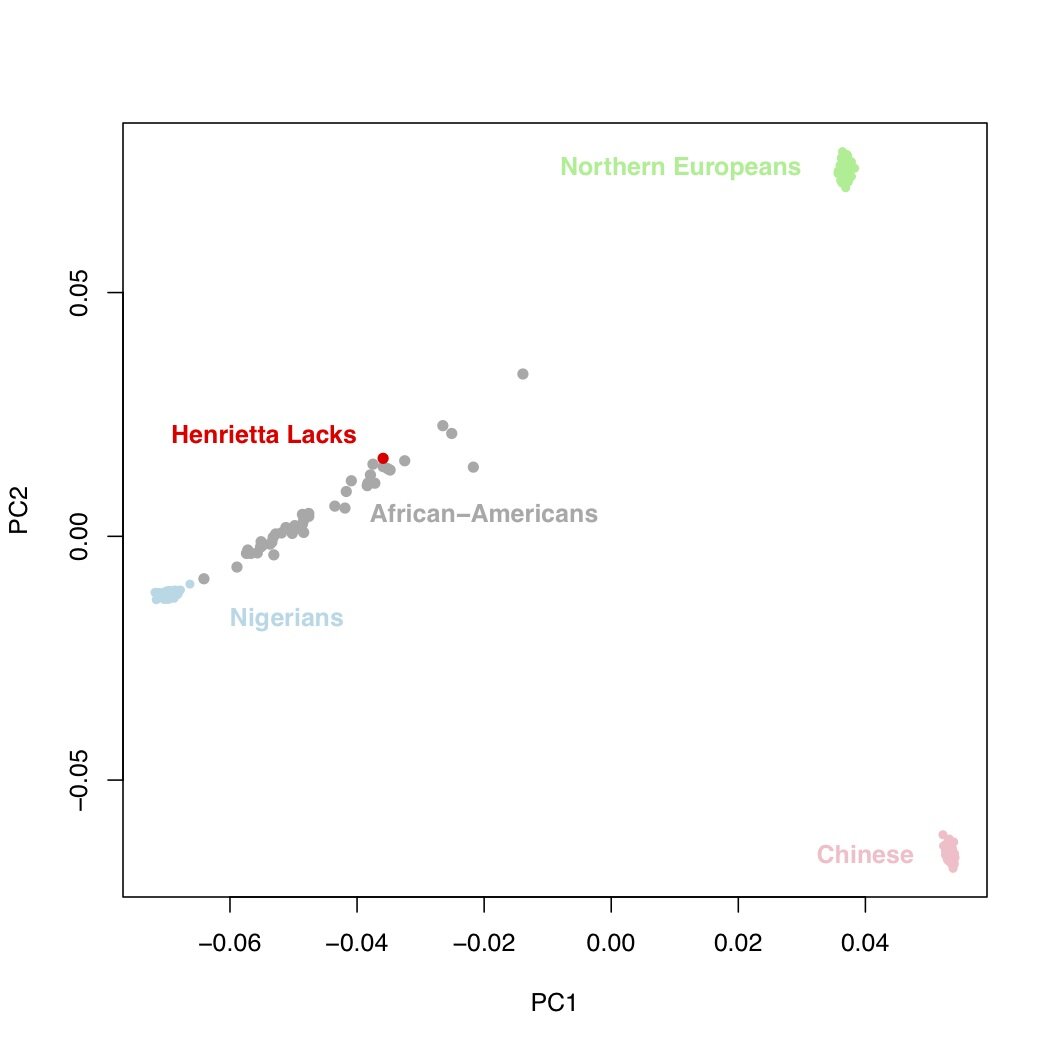
However, it is unfair to treat the authors of this paper as scapegoats for the systematic failure of scientists to deal with issues surrounding genomic “privacy”. Consider this important piece of information: the genome sequence of the HeLa cell line has been publicly available for years (and remains so).
hela

Continue reading ‘Henrietta Lacks’s genome sequence has been publicly available for years’

Looking closer at natural selection in inflammatory bowel disease

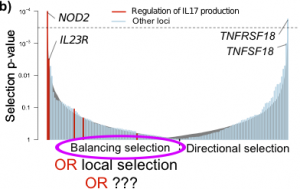
As I mentioned a few weeks ago, we recently published a large study into the genetics of inflammatory bowel disease (IBD), which included a number of analyses digging into the biology and evolutionary history of IBD genetic risk. Gratifyingly, our paper has stimulated a lot of discussion among other scientists, which has generated several ideas about future directions for this work. One question that was raised by several population-genetics experts at ASHG was about our natural selection analysis, and in particular our claim to discover an enrichment of balancing selection in IBD loci. In the paper, we found clear signals of natural selection on IBD loci, a subset of which we interpreted as balancing selection. In this post I will set out how I came to this conclusion, but then outline another explanation that could explain the results: recent local positive selection in Europeans.

Continue reading ‘Looking closer at natural selection in inflammatory bowel disease’

Identifying targets of natural selection in human and dog evolution

Over the course of the past year or so, I’ve been working (with Jonathan Pritchard) on a statistical method for learning about the history of a set of populations from genetic data. Much of this work is described in a paper we recently made available as a preprint [1]. However, as many readers will know, writing a paper involves deciding which results are important to the main point (and worth fleshing out in detail), and which aren’t. In this post, I’m going to describe some results and thoughts that didn’t quite make the cut, but which I think merit a small note. In particular, I’m going to discuss how having a demographic model for a large number of populations might be used to identify genes important in adaptation, and describe results from humans and dogs.

Background

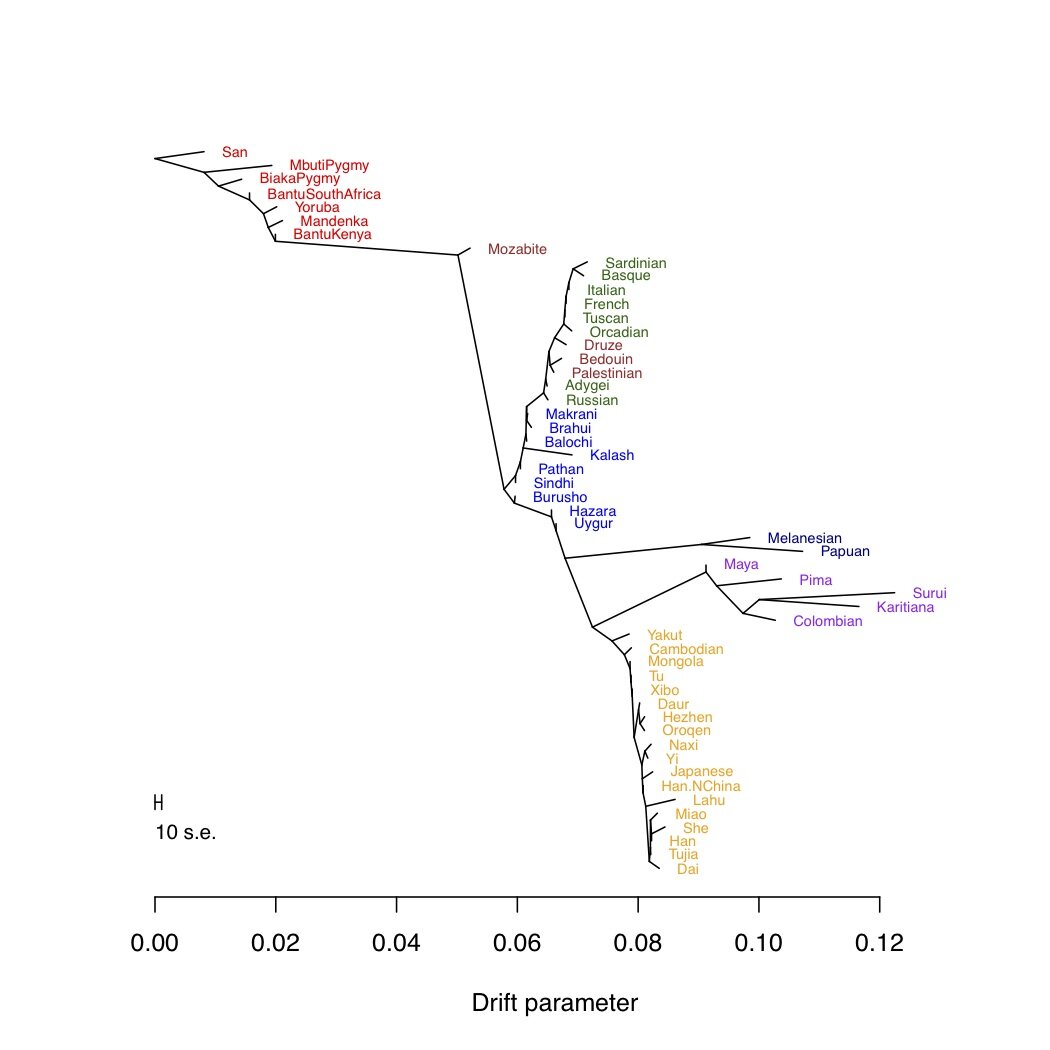
Imagine you have genome-wide genetic data (from SNP arrays, genome sequencing, or whatever) from a number of populations in a species. A common way to visualize the relationship between your populations is to use a tree. For example, below I’ve built a tree of the 53 human populations from the Human Genome Diversity Panel (using the data from Li et al. [2]).

HGDP Tree

Maximum likelihood tree of 53 human populations built using TreeMix.

Continue reading ‘Identifying targets of natural selection in human and dog evolution’

Notes on the evidence for extensive RNA editing in humans

UPDATE 3/17/12: A more extensive analysis of the paper discussed in this post is here. Several groups have concluded that at least 90% of the sites identified are technical artifacts

The “central dogma” of molecular biology holds that the information present in DNA is transferred to RNA and then to protein. In a paper published online at Science yesterday, Li and colleagues report a potentially extraordinary observation: they show evidence that, within any given individual, there are tens of thousands of places where transcribed RNA does not match the template DNA from which it is derived [1]. This phenomenon, called RNA editing, is generally thought to be limited (in humans) to conversions of the base adenosine to the base inosine (which is read as guanine by DNA sequencers), and occasionally from cytosine to uracil. In contrast, these authors report that any type of base can be converted to any other type of base.

If these observations are correct, they represent a fundamental change in how we view the process of gene regulation. However, in this post I am going to point out a couple of technical issues that, if not properly taken into account, have the potential to cause a large number of false positives in this type of data. The main point can be summarized like this: RNA editing involves the production of two different RNA and/or protein sequences from a single DNA sequence. To infer RNA editing from the presence of two different RNA and/or protein sequences, then, one must be very sure that they derive from the same DNA sequence, rather than from two different copies of the DNA (due to, for example, paralogs or copy number variants). Although this issue has the potential to be a large source of false positives in a study like this, I will discuss an additional technical problem that could also result in false positives.

Continue reading ‘Notes on the evidence for extensive RNA editing in humans’

My Genome Online – A Challenge To You

[Editor’s Note: This guest post is contributed by Blaine Bettinger. Blaine is the author of The Genetic Genealogist, a blog that examines the intersection of genetics and ancestry, and a patent attorney at Bond, Schoeneck & King in Syracuse, NY.]

As you may have heard, I recently made my 23andMe and Family Tree DNA autosomal testing results available for download online at “mygenotype,” and dedicated the information to the public domain (if dedicating DNA sequence to the public domain is even possible – I’m currently doing some research in this area and expect to write more in the future). [Editor’s Note: see additional comments on personal genomics data in the public domain at the end of this post.]

At “mygenotype” you can download the following:

My Family Tree DNA Results:

  1. Affymetrix Autosomal DNA Results (2010)
  2. Affymetrix X-Chromosome DNA Results (2010)
  3. Illumina Autosomal DNA Results (2011)
  4. Illumina X-Chromosome DNA Results (2011)

My 23andMe Results:

  1. V2 Results (2008)
  2. V3 Results (2010)
  3. Y-DNA Results (2010)
  4. mtDNA Results (2010)

You can also find my SNPedia Promethease reports:

  • Promethease Report using an early version of Affymetrix Family Finder DNA Results
  • Promethease Report using V2 23andMe DNA Results
  • Promethease Report using pooled 23andMe and Family Finder DNA Results

In addition to my genome, Razib Khan of Gene Expression has a spreadsheet of approximately 48 other genomes that are available for download online.

A Challenge To YOU

Now that the information is out there, available to anyone who might be interested, it remains to be seen who might be interested in the information.

Continue reading ‘My Genome Online – A Challenge To You’

At odds with disease risk estimates

It's all a game of Risk!

The first thing I did when I received my genotyping results from 23andMe was log on to their website and take a look at my estimated disease risks. For most people, these estimates are one of the primary reasons for buying a direct to consumer (DTC) genetics kit. But how accurate are these disease risk estimates? How robust is the information that goes into calculating them? In a previous post I focused on how odds ratios (the ratio of the odds of disease if allele A is carried as opposed to allele B) can vary across different populations, environments and age groups and, as a consequence, affect disease risk estimates.  It turns out that even if we forget about these concerns for a moment, getting an accurate estimate of disease risk is far from straightforward. One of the primary challenges is deciding which disease loci to include in the risk prediction and in this post I will investigate the effect this decision can have on risk estimates.

To help me in my quest, I will use ulcerative colitis (UC) as an example throughout the post, estimating Genomes Unzipped members’ risk for the disease as I go. Ulcerative colitis is one of two common forms of autoimmune infllammatory bowel disease and I have selected it not on the basis of any special properties (either genetic or biological) but because I am familiar with the genetics of the disease having worked on it extensively.

The table below gives our ulcerative colitis risks according to 23andMe. The numbers in the table represent the percentage of people 23andMe would expect to suffer from UC given our genotype data (after taking our sex and ethnicity into account). The colours highlight individuals who fall into 23andMe’s “increased risk” (red) or “decreased risk” (blue) categories based on comparisons with the average risk (males: 0.77%; females 0.51%). As far as I am aware none of us actually do suffer from UC.
Continue reading ‘At odds with disease risk estimates’


Page optimized by WP Minify WordPress Plugin