I agreed to make my 23andMe genotyping results publicly available as part of GNZ without a moment’s hesitation. This is in part because I knew the results were actually a bit dull (in a good way, I suppose) – I’m not at vastly increased or decreased risk for any diseases (based on research so far), and I was unsurprised to find out that I have blue eyes. I was also unsurprised that 23andMe identified me as most likely of north European ancestry.
Several hours after we released our data, however, I was pointed to a post where Dienekes Pontikos wrote about the results of running all our data through his ancestry prediction program. While just about everyone was quite confidently predicted to be almost entirely of northwestern European descent, this analysis gave me a point estimate of 20% Ashkenazi Jewish ancestry. Within hours, several people had asked me about this, and I had no real response. So I decided to take a look at the data myself; some basic analyses are below.
What does Dienekes’s program do?
First, a quick bit of background. The program used above is based on a paper exploring differences in allele frequencies (population structure) in European-Americans [1]. In that study, the authors identified two major components of variation in ancestry, roughly corresponding to three clusters of individuals: those of predominantly northwest European descent, southeast European descent, and Ashkenazi Jewish descent. They assembled a list of ~300 genetic markers which were highly informative about ancestry in their sample, and made publicly available the allele frequencies of those markers in the three groups.
What Dienekes’s program does is use those allele frequencies (at the ~150 markers that are included in the 23andMe genotyping platform) to infer the proportional membership of an individual in each group. For example, if an individual has the genotype CC at a SNP, and the C allele has 20% frequency in northwestern Europe and 60% frequency in the Ashkenazi, that provides some evidence that the individual in question is more likely to be Ashkenazi. Summed across all loci, one can estimate the overall fraction of the genome of the individual from each group.
It’s this estimate that put me at 20% Ashkenazi ancestry. The confidence intervals for this estimate overlapped zero, indicating that there wasn’t enough data to make any confident claims about this, but it was certainly suggestive (and note that my GNZ colleague Vincent Plagnol was also predicted to have a sizeable amount of Ashkenazi ancestry).
But what does this estimate actually mean? It doesn’t really mean that I’m predicted to have 20% Ashkenazi ancestry. More precisely, it means that I carry a subset of alleles that are relatively rare in northwestern and southeastern Europe, but relatively common in the Ashkenazi Jewish population. The leap from this (undoubtedly true) statement to a statement about ancestry makes an extremely important modeling assumption: namely, that these three populations (northwest European, southeast European, and Ashkenazi Jewish) are the only three possibilities for my ancestry. This sort of assumption is implicit in every ancestry test available, and though this is not news (Dienekes gave this as a potential explanation for the results himself), it’s important to make explicit.
What other populations could I be partially descended from? Well, how about southwest Europe? (Ok, this isn’t just speculation. I know one of my grandparents is of Italian descent, and it’s known that southern European populations look a bit like the Ashkenazi population in genetic terms [2]). To test this, let’s look at some data.
Visualizing population structure with Genomes Unzipped data
To explore how the GNZ participants relate to European populations, I combined a few data sources: the European samples from the Human Genome Diversity panel [3], the 12 GNZ individuals, and a set of Ashkenazi Jewish individuals [4], all genotyped on Illumina arrays (though combining data sets raises the possibility of batch effects, I saw no major problems in these data).
To visualize the relationships between these individuals, I used principal components analysis, as implemented in the program smartpca [5]. (When applied to genotype data [6], this method is a nice way to assess the average genetic relationships between individuals and populations [7,8])
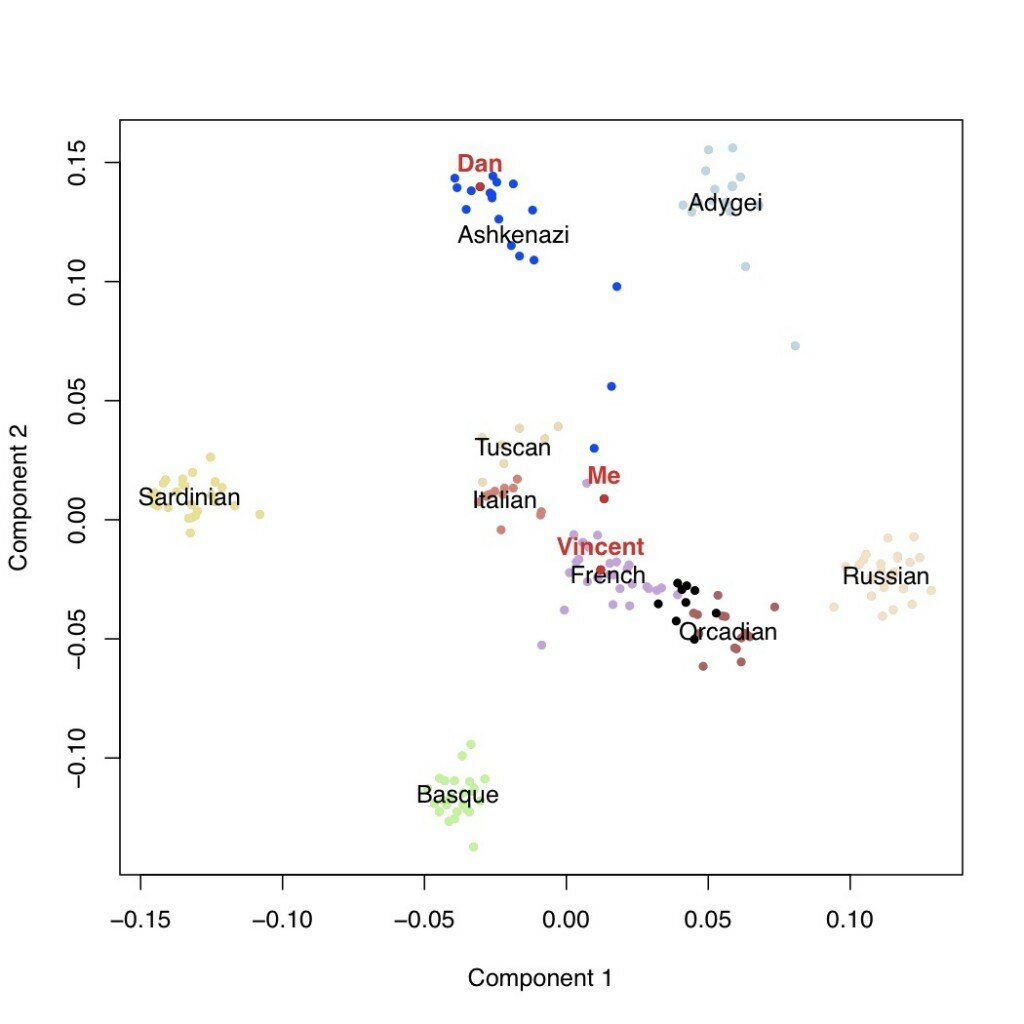
In the plot below, each point is an individual, positioned on the first and second most important axes of genetic variation in this sample. The Ashkenazi population is in blue, the HGDP populations are in the other colors, and the GNZ individuals are in black. I’ve labeled myself, Vincent, and Dan Vorhaus in red. As you can see, the majority of GNZ participants cluster together between the French and the Orcadians (from Scotland). Dan, Vincent, and myself are all somewhat outside this cluster – Dan with the Ashkenazi population, Vincent with the French, and me with the French on component 1 and the Italians on component 2.

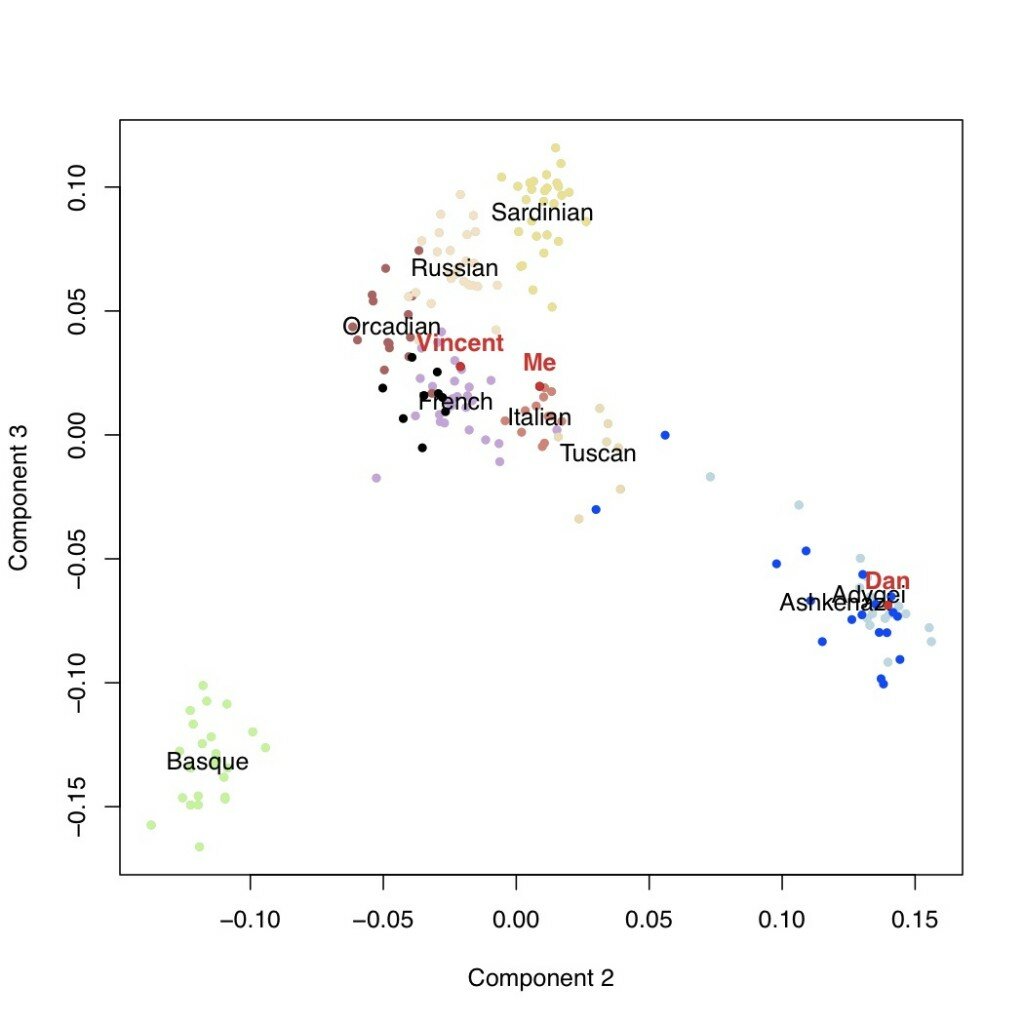
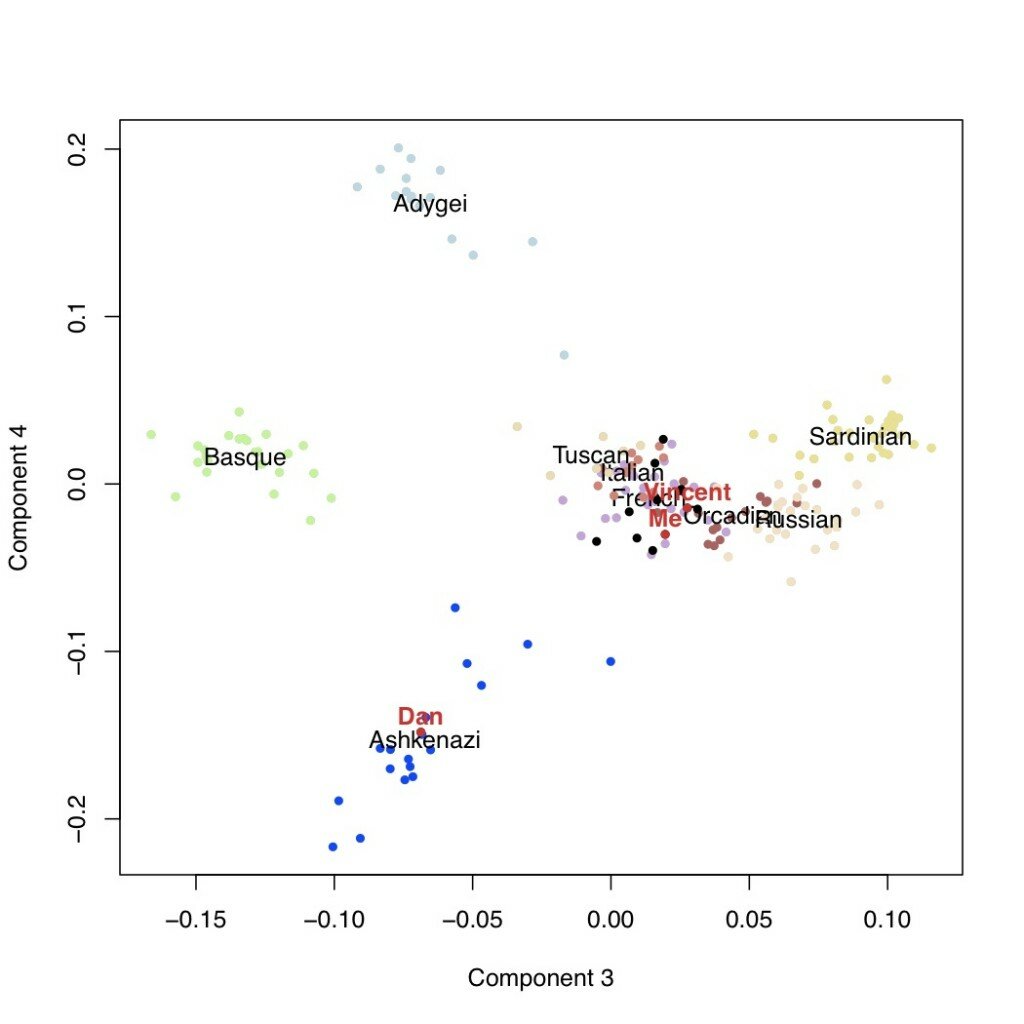
We can look then at additional components of variation. In the next plots are the second versus third components, followed by the third versus the fourth. This latter one is potentially telling: the fourth axis of variation separates the Ashkenazi population (including Dan, who I’m using as a posisitve control) from the rest of Europe. Neither I nor Vincent appear to have any detectable weight on this component.


Conclusions
The above analysis suggests that I do not, in fact, have any Ashkenazi Jewish ancestry (and neither does Vincent), but rather that the initial results were due to “hidden” south European ancestry. (I tested this a bit more, and things seem to hold up [9], and a separate analysis performed over at the Eurogenes blog came to a similar conclusion).
This is far from a fully rigorous treatment, of course. The analysis above averages information across the genome; a comprehensive analysis would segment my genome into parts descended from different populations (as done, for example, in HAPMIX [10]). At the moment, it’s unclear how well this type of method applied to current data would perform in distinguishing segments from closely related populations.
That said, I’ve satisfied my curiosity: based on my knowledge of family history and the above PCA plots, I’m convinced I have a bit of south European ancestry in a genome of largely northwest European background.
—–
[1] Price et al. (2008) Discerning the Ancestry of European Americans in Genetic Association Studies. PLoS Genetics. doi:10.1371/journal.pgen.0030236
[2] Seldin et al. (2006) European Population Substructure: Clustering of Northern and Southern Populations. PLoS Genetics. doi:10.1371/journal.pgen.0020143
[3] Li et al. (2008) Worldwide Human Relationships Inferred from Genome-Wide Patterns of Variation. Science. DOI: 10.1126/science.1153717
[4] Behar et al. (2010) The genome-wide structure of the Jewish people. Nature. doi:10.1038/nature09103
[5] Price et al. (2006) Principal components analysis corrects for stratification in genome-wide association studies. Nature Genetics. doi:10.1038/ng1847
[6] Patterson et al. (2006) Population Structure and Eigenanalysis. PLoS Genetics. doi:10.1371/journal.pgen.0020190
[7] McVean (2009) A genealogical interpretation of principal components analysis. PLoS Genetics. doi:10.1371/journal.pgen.1000686
[8] Novembre and Stephens (2008) Interpreting principal component analyses of spatial population genetic variation. Nature Genetics. doi:10.1038/ng.139
[9] I identified the SNPs providing the most evidence for Jewish ancestry in my genome in Dienekes’s analysis and found their allele frequencies in the Italian population. Though I didn’t perform any formal analysis, these SNPs tended to have similar frequencies in the Italian and Ashkenazi populations. For example, my genotype at rs847851 is AA, and the A allele is at ~25% in northwest Europe and ~50% in the Ashkenazi. It’s also at 46% in Italy.
[10] Price et al. (2009) Sensitive Detection of Chromosomal Segments of Distinct Ancestry in Admixed Populations. PLoS Genetics. doi:10.1371/journal.pgen.1000519


 RSS
RSS Twitter
Your analysis was very interesting. It shows that we are able to find out only what we’re looking for, and not anything else.
I had a similar experience using euro-dna-calc-11 and my 23AndMe data. The confidence interval was from 0 to 34%. I have no documented Jewish ancestors.
I do have more than 730 “DNA cousins” at 23AndMe including matches to people with “declared Askenazi sequences”, and a fair number of matches at FamilyTree DNA, where the autosomal test is more recent. These matches are mostly to people with grandparents born in Poland, Lithuania, Belarus, Russia and Germany.
With the exception of one 2Ggardfather from Germany (according to the census), who left one offspring in America in 1850, my ancestors have been in America since the 1700s or slightly earlier.
For data analyses based on the GNZ and other public data, you should make it a habit to also share the source code for the methods whenever possible.
Very nice description, thanks for sharing it!
For data analyses based on the GNZ and other public data, you should make it a habit to also share the source code for the methods whenever possible.
no code on my end was necessary (except to get all the data in the proper format). smartpca is available as part of the EIGENSOFT package from the Reich lab:
http://genepath.med.harvard.edu/~reich/
IBD can also give information about Ashkenazi ancestry. A good test for Ashkenazi ancestry is to look for blue segments with the 23andMe Ancestry Finder ( https://www.23andme.com/you/labs/ancestry_finder/ ) with the Ashkenazi box checked and the most permissive settings (5 cM, 1+ grandparents from same country, and include US, etc.); non-Ashkenazi individuals may still have a handful of matches with Ashkenazi grandparents (particularly when not all four grandparents are Ashkenazi), but a more substantial number of blue segments with all four grandparents declared Ashkenazi should be good evidence of Ashkenazi ancestry. Another good indicator is the # of Relative Finder cousins, particularly the number of “distant cousins”; as of right now, having more than 1000 Relative Finder cousins is a pretty solid indicator of recent Ashkenazi ancestry.
A good recent thread related to this on the 23andMe forums is here: https://www.23andme.com/you/community/thread/4570/
Greg, thanks, I’d not seen that feature. It’s pretty clever.
According to that analysis as well, I have a bit of Ashkenazi ancestry (15-30%, or 3-6% if restricting to only 4 grandparents from the same place). I’d be slightly suspicious again, though, about what exactly this means. Certainly the results depend on the composition of the 23andMe database. My guess is that some groups are much more represented than others, and thus more likely to contribute IBD matches (ie., in this analysis I appear to have no Italian ancestry). It would be nice to see some PCA maps of the 23andMe database to figure this out.
This article by C. Nash (Genetic Tests for Genealogy: 10 Reasons to Be Wary) might be of interest ! (http://www.omics-ethics.org/observatoire/cadrages/cadr2006/c_no29_06/ca_no29_06_01.html)
Interesting thanks.
I am MT1 in the biogeographic project of Polako’s. MT means Malta. I was born there and all my ancestry comes from there as far as I have checked which is to the 1400s in most lines. My surname is very common in Malta, and among Maltese people elsewhere in the world.
I have used Dienekes’ program. It said I was 87% SE European, 8% NW European and 5% Ashkenazim Jewish. The confidence intervals for the small figures intersect zero. I have no know NW European or Jewish ancestry. I don’t even have Italian ancestry in my genealogy. Polako’s tests nearly always place me and some South Italians, Calabrians, Sicilians etc, into the Jewish clusters some distance removed from the Tuscan Italians. Not complaining but it seems no one is prepared to find out the differences between Southeast Europeans and European Jews but are concentrating on finding that elusive Cherokee Princess or some obscure connection to Vikings. I left 23andMe as it does nothing for non Americans, non WASPs, and its BGA is frankly inadequate.
“finding that elusive Cherokee Princess or some obscure connection to Vikings”
funny!
Ponto: what does “BGA” stand for??? Also, another reason for leaving 23andMe is if you have an allergic reaction to relentless posts like “from New Jersey” or “I think my mom’s mom was from Idaho” in haplogroup discussion threads. (Maybe she was living in Idaho 8000 years ago.)
I really enjoyed the way this author took the bull by the horns and went to work on his own data. (I don’t know much about this area, but I thought it was good read and makes me want to know more!)
j
I’m 100% Northwest European (3/4 Isles, 1/4 German), and a tiny 1.0% Ashkenazi on 23andme’s AF at 1 GP, 5 cM, and negative for all other genetic tests for Ashkenazi. But, surprisingly, I scored 31% Ashkenazi on EURO-DNA-CALC, that was kindly run by Spence, another 23andme customer, (a couple days ago). The confidence interval was [16, 47] for Ashkenazi. The other two were Northwest Euro 69% Interval=[53, 84] and Southeast Euro 0% Interval=[0, 10].
In Dieneke’s October, 2010 blog on EURO-DNA-CALC it’s reported that an Ashkenazi score of 0 to 1.0% on AF, and a high Ashkenazi score in EURO-DNA-CALC is the result of Mediterranean ancestry masquerading as Ashkenazi heritage. So that definitely would apply to me. I also scored AA on SNP rs9544611 (which codes for hair color, mine was dark brown). The C version of this SNP is associated with blond hair. Only two other individuals, both Mediterranean origin, have so far reported AA for this SNP at a 23andme thread. So, this could be another indicator of hidden Mediterranean ancestry, probably on my late Dad’s side.
GNMCHDKQCC louis vuitton bag LCLDCGQBCQ http://www.cra.org/member/19620/